Machine Learning - k-means Cluster
This page shows the part of my research project for the Machine Learning for Data Analysis course by Wesleyan University on Coursera (Week 4 Assignment: Running a k-means Cluster Analysis). The research topic and data set are described here.
Summary of the k-means Cluster Analysis
With the Add Health Wave 1 dataset (TreeAddHealth version), a k-means cluster analysis was conducted to identify underlying subgroups of adolescents based on their similarity of responses on 16 variables that represent characteristics that could have an impact on deviance (such behaviors as vandalism, other property damage, lying, stealing, running away, driving without permission, alcohol problems, selling drugs, and skipping school).Clustering variables included binary substance use variables that measured whether the adolescent had ever used alcohol, marijuana or inhalants. Additional categorical variables included the availability of cigarettes in the home, whether or not either parent was on public assistance and any experience with being expelled from school. Quantitative clustering variables include age, a measure of depression, and others measuring self-esteem, parental presence, parental activities, family connectedness and grade point average. All variables were standardized to have a mean of zero and a standard deviation of one.
Data were randomly split into a training set that included 70% of the observations (N=3201) and a test set that included 30% of the observations (N=1701). A series of k-means cluster analyses were conducted on the training data specifying k=1-9 clusters, using Euclidean distance. The variance in the clustering variables that was accounted for by the clusters (R-square) was plotted for each of the nine cluster solutions in an elbow curve to provide guidance for choosing the number of clusters to interpret.
Figure 1. Elbow curve of R-square values for the nine cluster solutions
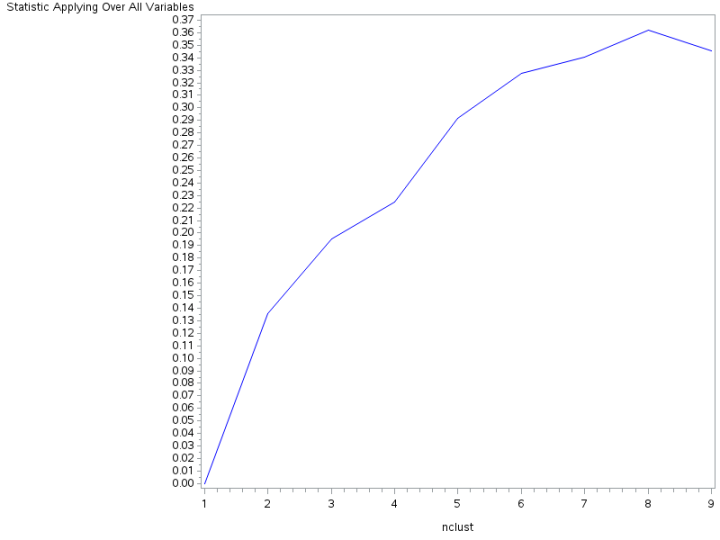
The elbow curve was not conclusive, suggesting that the 2, 3, 5 and 6-cluster solutions might be interpreted. The results below are for an interpretation of the 3-cluster solution.
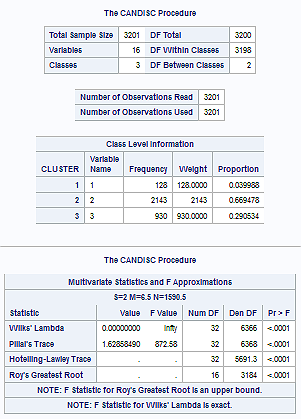
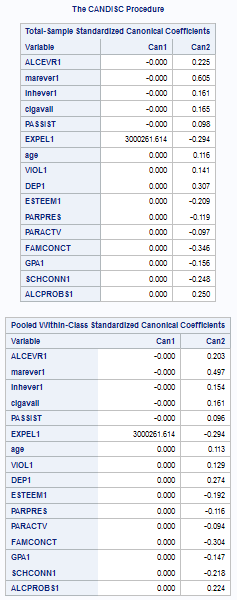
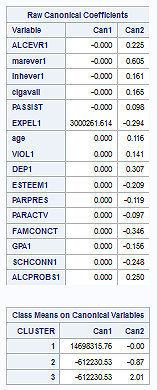
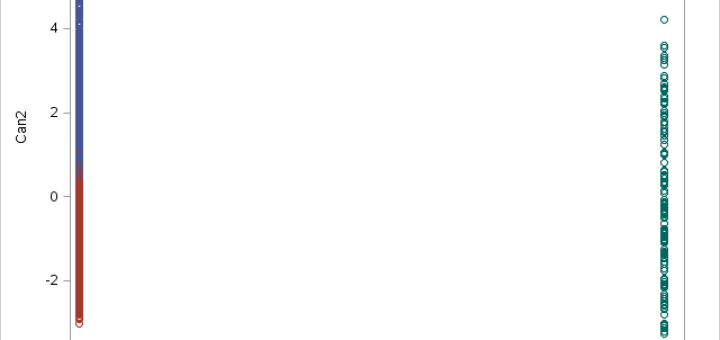
Canonical discriminant analyses were used to reduce the 16 clustering variable down a few variables that accounted for most of the variance in the clustering variables. As shown in Figure 2 below, the scatter plot of the first two canonical variables (Can1 and Can2) by cluster indicated that the observations in clusters 2 and 3 were slightly overlapped with relatively low within cluster variance, while cluster 1 was quite distinct and did not overlap with the other clusters at all.
Figure 2. Plot of the first two canonical variables for the clustering variables by cluster (k=3).
The means on the clustering variables shows that adolescents in cluster 1 have a very high likelihood of having experience with being expelled from school, clearly indicating the most troubled adolescents. Adolescents in cluster 2 and 3 are much less likely to have any experience with being expelled from school. However, adolescent in cluster 3 have a relatively high likelihood of having used marijuana, more alcohol problems, higher levels of depression, lower self-esteem, and the lowest levels of school connectedness, parental presence, involvement of parents in activities, and family connectedness, compared to the other clusters. Adolescent in cluster 2 appear to be the least troubled group. They are least likely to have used alcohol and marijuana, and also have the lowest levels of depression, and higher self-esteem, school connectedness, parental presence, parental involvement in activities and family connectedness.
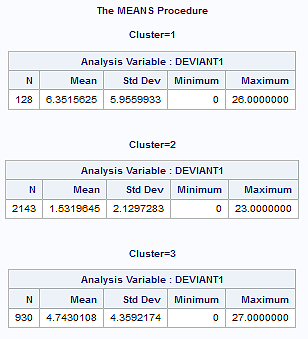
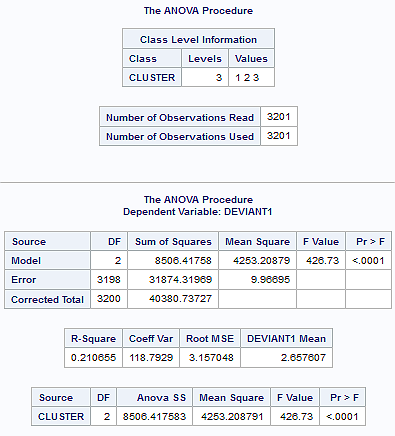
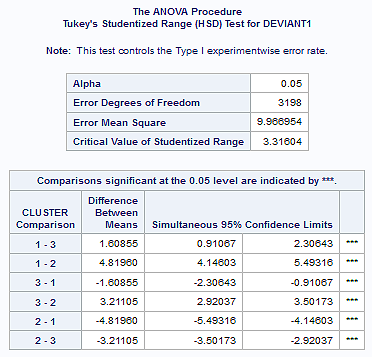
In order to externally validate the clusters, an Analysis of Variance (ANOVA) was conducting to test for significant differences between the clusters on a measure of deviance (in the scale of 0 – 6). A tukey test was used for post hoc comparisons between the clusters. The results from the tukey test indicated significant differences between the clusters on deviance measure (F= 426.73, p<.0001). The means of clusters 1, 2 and 3 were 6.35 (sd= 5.96), 1.53 (sd=2.13) and 4.74 (sd=4.36), respectively. That is, adolescents in cluster 1, the most troubled group, had the highest deviance score while those in cluster 2, the least troubled group, had the lowest deviance score.
SAS Program Code
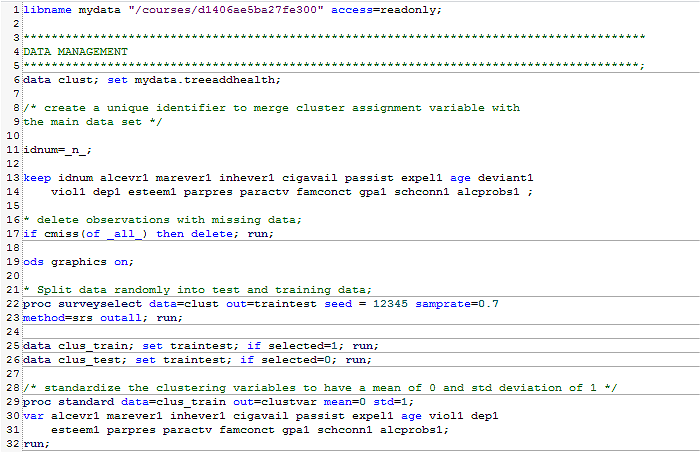
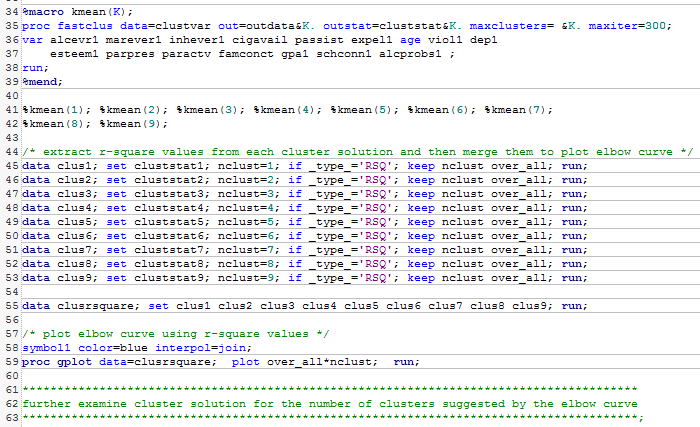
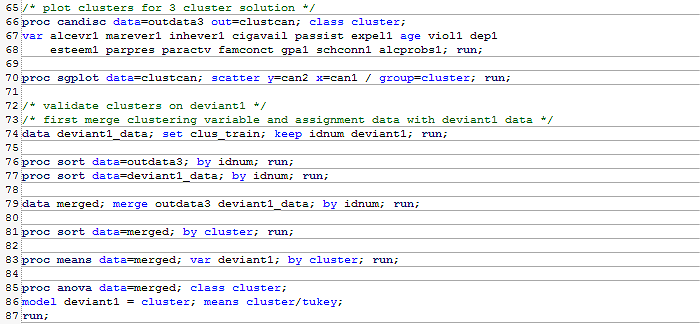
SAS Program Output