Exploratory Data Analysis: Frequency Distributions Analysis
This page shows the part of my research project for the Data Management and Visualization course on Coursera. This page shows the progress of my research project for the Data Management and Visualization course on Coursera (Week 2 Assignment: Running Your First Program). The research topic and data set are described here.
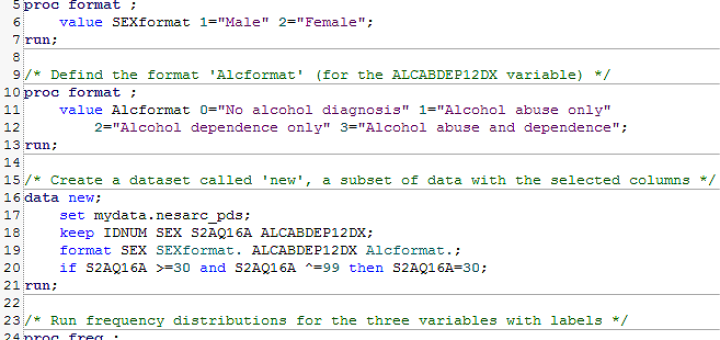
SAS Program Code
SAS Program Output
Summary of Frequency Distributions Analysis
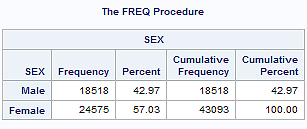
The NESARC data were obtained from a sample of 43,093 adults (18 years and older) in the U.S. general population (the NESARC sample).
As shown in the first frequency distribution table, the sample consists of 18,518 males (42.97%) and 24,575 females (57.03%).
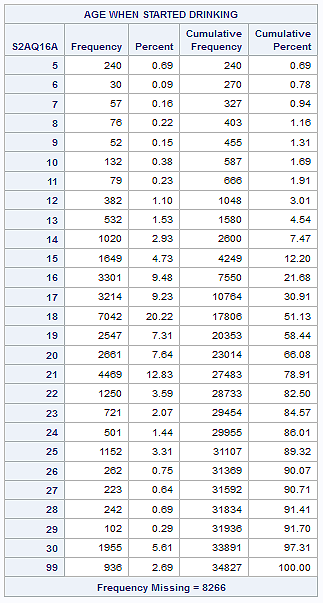
The participants of the NESARC study were asked the following question: “About how old were you when you first started drinking, not counting small tastes or sips of alcohol?” Of the respondents, about 51.13% (17,806 among 34,827 people who have ever drunk) started drinking when they were 18 years or younger, as shown in the second table. About 7.47% started drinking at the age of 14 or younger. Note that the value of 30 for the S2AQ16A variable corresponds to 30 years and older (see the programming code) while 99 corresponds to the age unknown. On the other hand, the frequency of missing value (8,266) represents the number of people who have never drunk.
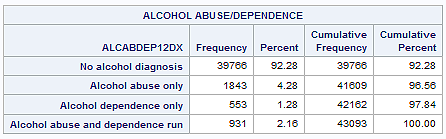
The third frequency distribution table shows the prevalence of alcohol use disorder (alcohol abuse and/or dependence). Of the respondents, about 7.72% have symptoms of alcohol use disorder: 4.28%= alcohol abuse only, 1.2%=alcohol dependence only and 2.16%= alcohol abuse & dependence. The rest, about 92.28%, do not have any alcohol use disorder. [Note that the ALCABDEP12DX variable (ALCOHOL ABUSE/DEPENDENCE IN LAST 12 MONTHS) is from a DSM–IV diagnosis based on an extensive list of symptom questions, not just a single question.]