Creating Graphs using SAS
This page shows the part of my research project for the Data Management and Visualization course on Coursera (Week 4 Assignment: Creating graphs). The research topic and data set are described here.
SAS Program Code
SAS Program Output (Graphs) & Descriptions
The Univariate Graph of AgeGroup (Survey Participants’ Age Group):
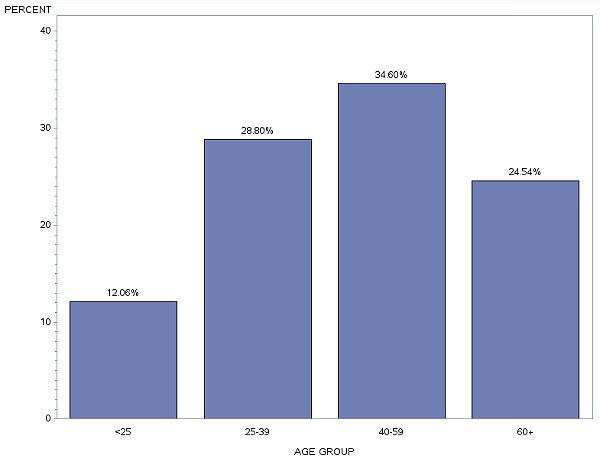
This graph is unimodal, with its highest peak at 40-59 years old. The distribution of the survey participants’ age group appears to be skewed a little to the left.
The Univariate Graph of SEX (Survey Participants’ Gender):
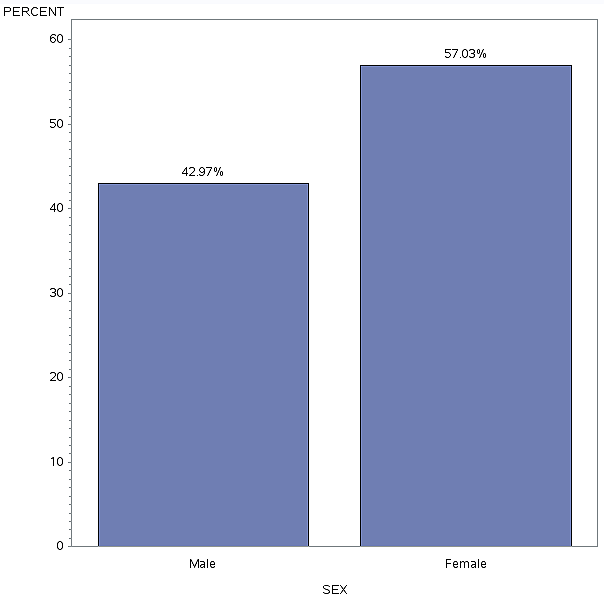
There are more female than male in the sample: 42.97% males vs. 57.03% females.
The Univariate Graph of AgeAlcUse (Age Range When First Started Drinking):
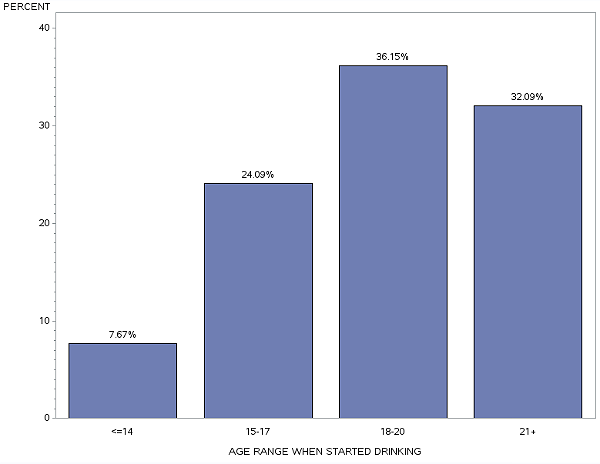
This graph is unimodal, with its highest peak at 18-20 years old. The distribution of the Age Range When First Started Drinking appears to be skewed to the left as there are higher frequencies in the higher age ranges.
The Univariate Graph of ALCABDEP12DX (Alcohol Abuse/Dependence):

This graph shows the prevalence of alcohol use disorder (alcohol abuse and/or dependence). Of the respondents, about 7.72% have symptoms of alcohol use disorder: 4.28%=alcohol abuse only, 1.2%=alcohol dependence only and 2.16%= alcohol abuse & dependence. The rest, about 92.28%, do not have any alcohol use disorder.
The Scatter plot of S2AQ16A vs. AGE:
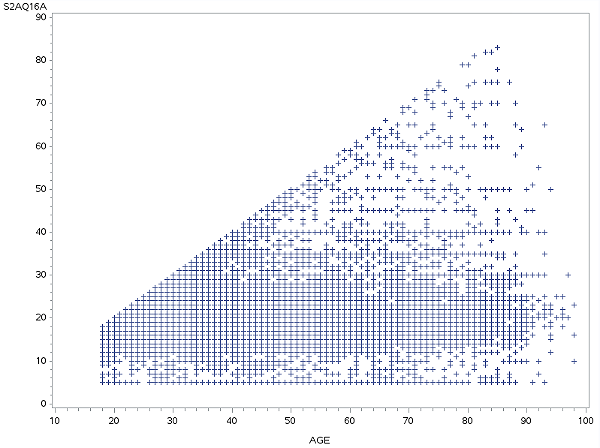
This bivariate graph plots the survey participants’ age (AGE) vs. age when they first started drinking alcohol (S2AQ16A). The scatter plot does not show a clear relationship/trend between the two variables, except the range of Age at first drink grows as the survey participants’ age increases, which is natural.
The Bar Graph of Prevalence of Alcohol Disorder vs. Age When First Started Drinking:
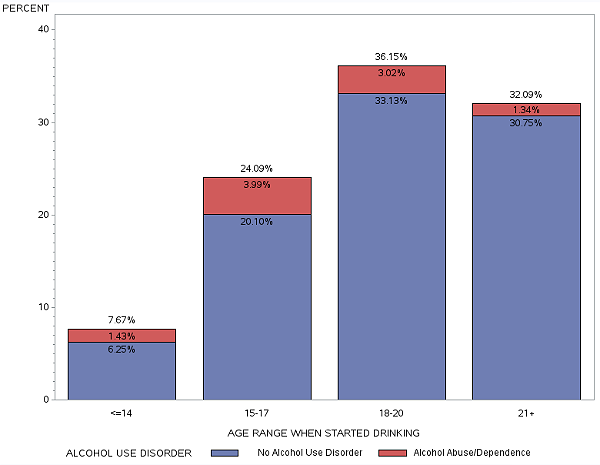
This bivariate graph shows the prevalence of alcohol disorder (AlcDisorder) for each age range when first started drinking (AgeAlcUse). This bar graph indicates the people who started drinking at the age range of 15-17 have developed alcohol use disorder more than any other groups of people. Thus there is a potential association between the AlcDisorder and AgeAlcUse variables.
The Bar Graph of Prevalence of Alcohol Disorder vs. Sex
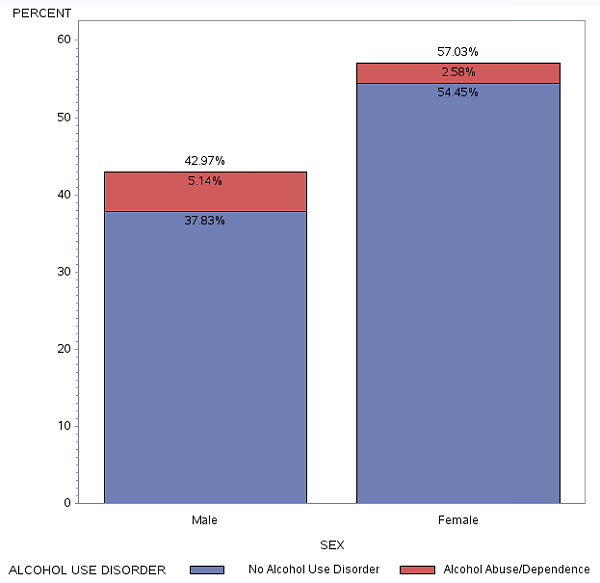
This bivariate graph shows the prevalence of alcohol disorder (AlcDisorder) for each gender (male and female) (SEX). The graph indicates there is a clear association between sex and prevalence of alcohol use disorder: Males are more likely to develop alcohol disorder than females.